The Beginner’s Guide to Using Resource Monitor on Your PC
Last Updated:
I’ve been using Resource Monitor ever since it was introduced in from Windows Vista.
And without a doubt, it’s a must-use feature for anyone who wants to analyze their system resources and those looking to troubleshoot Windows.
Think of it like using the Windows Task Manager, but with more detailed resource statistics. Yup, it’s that powerful!
Don’t worry if you’re new to the terminologies and graphs in Resource Monitor. I’m here to guide you with everything.
So, buckle up as we are getting started.
What You Can Do With Resource Monitor
First, let’s learn the different things that Windows Resource Monitor is capable of.
From checking hard faults and associated processes with Windows Services to finding out real-time disk usage and monitoring network traffic, there’s a lot!
Let me list them down for you:
- Check CPU’s real-time usage and maximum frequency
- Monitor disk’s input/output operation speed and highest active time
- Monitor network’s input/output operation speed and highest network utilization
- Inspect your physical memory’s hard faults/second and overall usage
- Find out the services, associated handles, and associated modules with Windows services
- Real-time analysis of disk/network activity of different processes
- Quick inspection of your storage space
- Find our the TCP connections and Listening Ports
The tool can be used when you’re troubleshooting issues related to high system usage or when diagnosing bottlenecks.
Note: The interface of this tool hasn’t changed. So, whether you’re on Windows 10 or 11, the idea of using it is the same.
Launching the Utility
For every Windows program, you’ll find different ways to launch them. Resource Monitor is no different!
Try any of the following, whichever you find the most useful:
- Run command:
resmon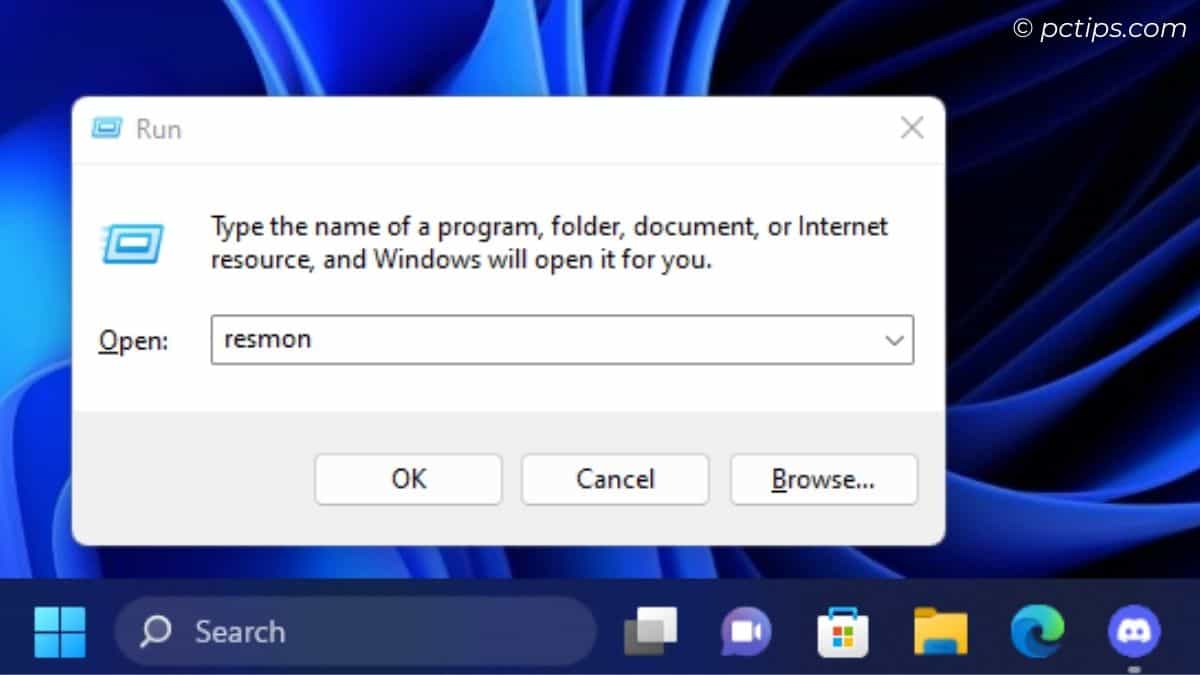
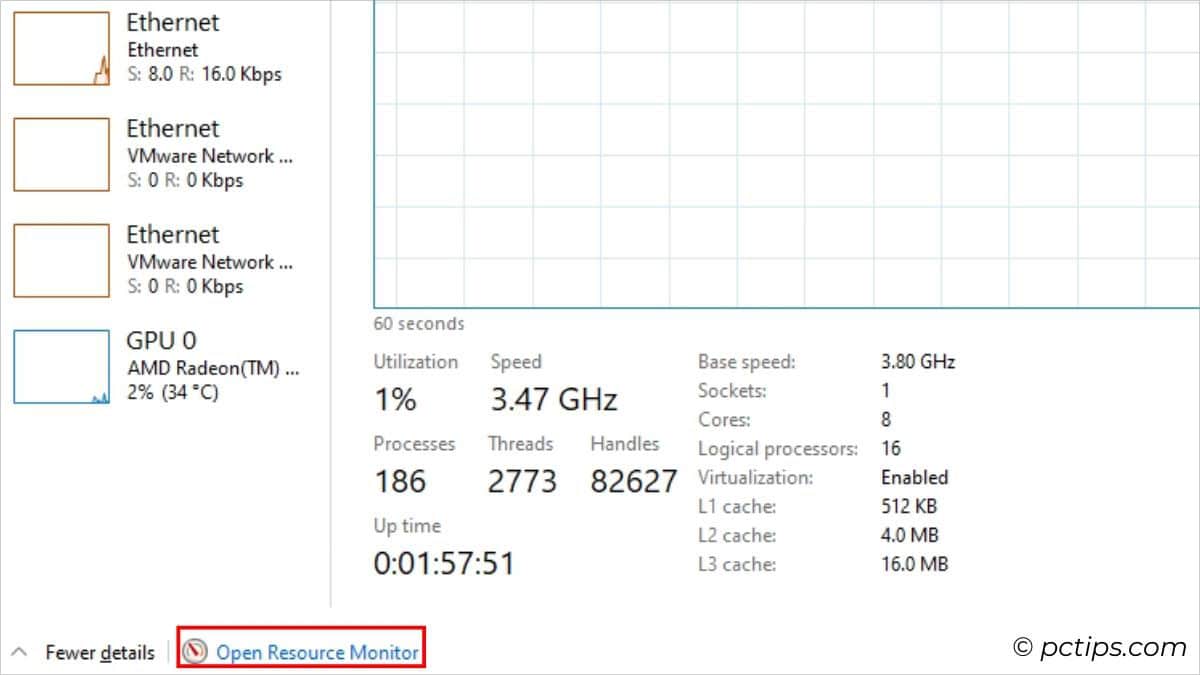
- Task Manager: Performance tab > Open Resource Monitor link (from the bottom)
- Windows Start Menu/Search: Type a relevant keyword, like ‘
Resource Monitor’ or ‘resmon’ and hit Enter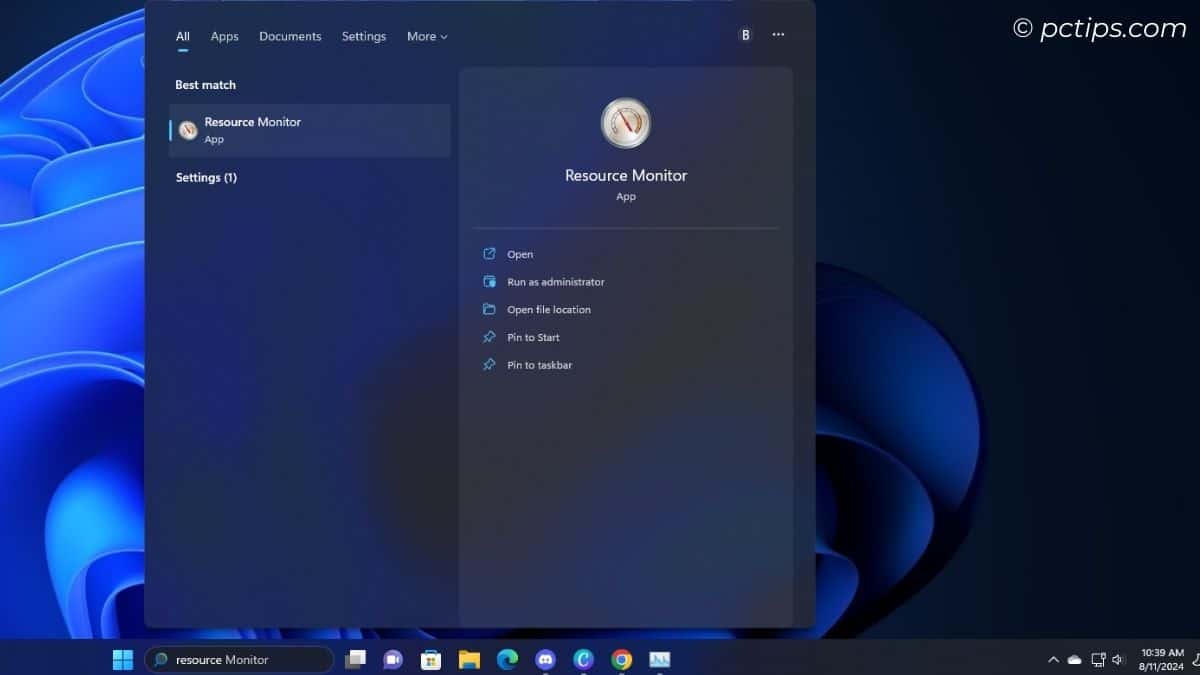
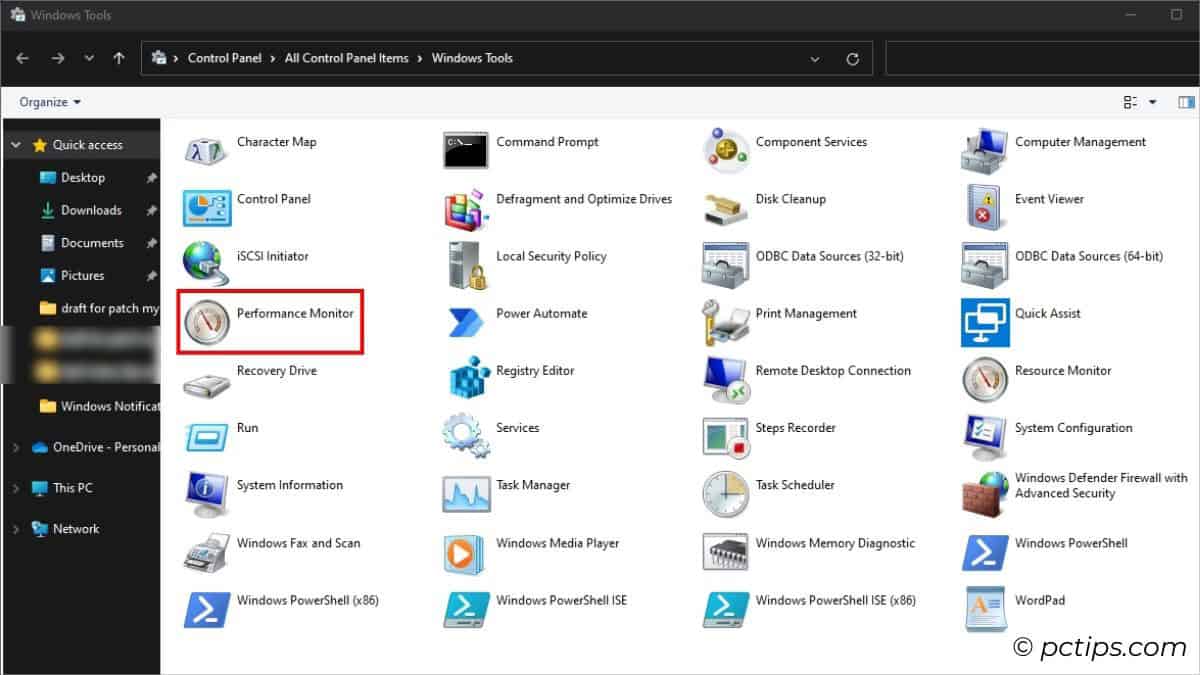
- Control Panel: Large/small icons > Windows Tools > Resource Monitor
Now that you’re in the Resource Monitor app, let’s start exploring each tab.
The ‘Overview’ Tab
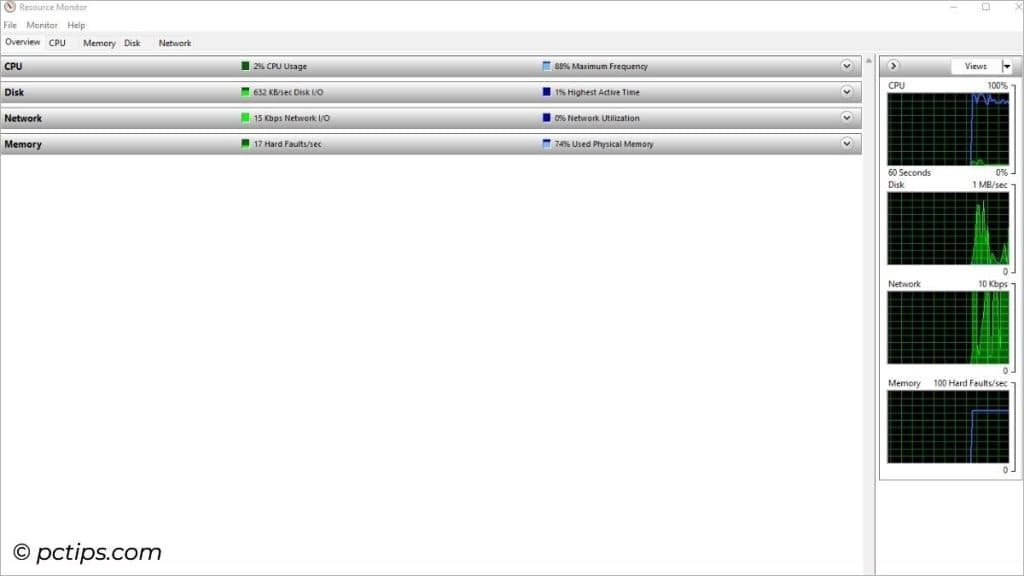
This is the first window you’ll see after opening the Resource Monitor app.
The tab features every component that you can monitor within the application and you can even view its basic properties.
Let’s get into them section by section.
CPU
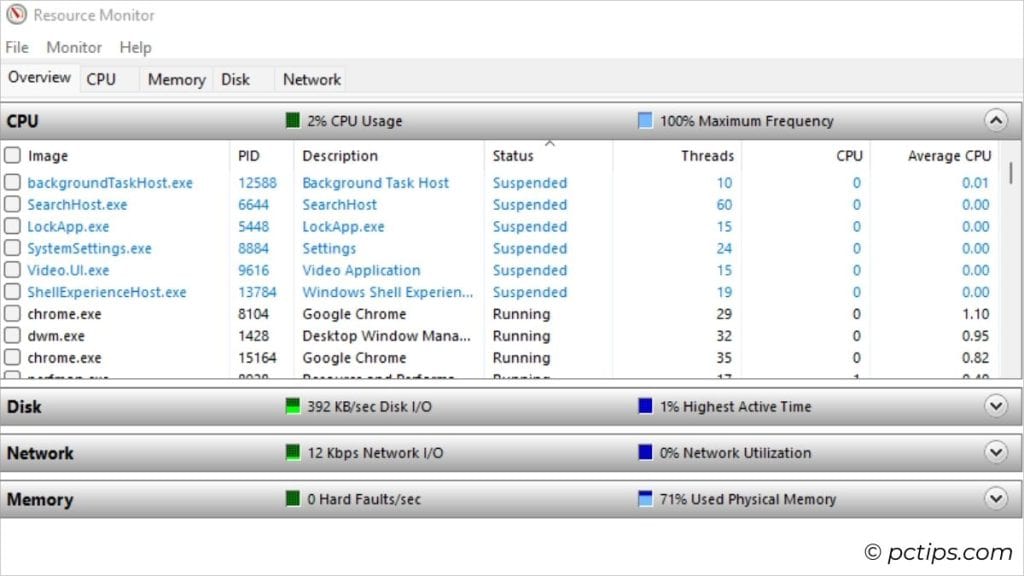
Starting off with CPU, here’s what you can inspect:
- Real-time usage: How much percentage of your processor is being utilized (100% means your computer can become slow)
- Maximum frequency: Percentage relative to the processor’s base clock speed
- Image: File name of each process
- PID: The ID of the processes listed in the Image column
- Description: Additional information about the Image
- Status: Learn whether the process is running/stopped/terminated/suspended
- Threads: No. of active threads used by each process
- CPU: Real-time processor consumption
- Average CPU: Avg. CPU consumption (in 60 seconds)
Disk

Similarly, when you expand Disk, you get to monitor:
- Disk I/O speed: Real-time overall read-write speed of your disk (in KB/s)
- Highest Active Time: The total time (in percentage) your disk is handling read/write requests
- Image and ID: Process name along with its process ID
- File: Shows the path of the file that’s consuming the disk resource (learn how to free it up)
- Read (B/sec): Avg. bytes/s read from the file at the final minute
- Write (B/sec): Avg. bytes/s written into the file at the final minute
- Total (B/sec): Avg. bytes/s read from and written into the file at the final minute
- I/O Priority: Shows how your OS prioritizes the processes (Normal/Background)
- Response Time (ms): The amount of time your disk takes to complete an I/O request
You might want to read: Visualizing disk space using WizTree
Network
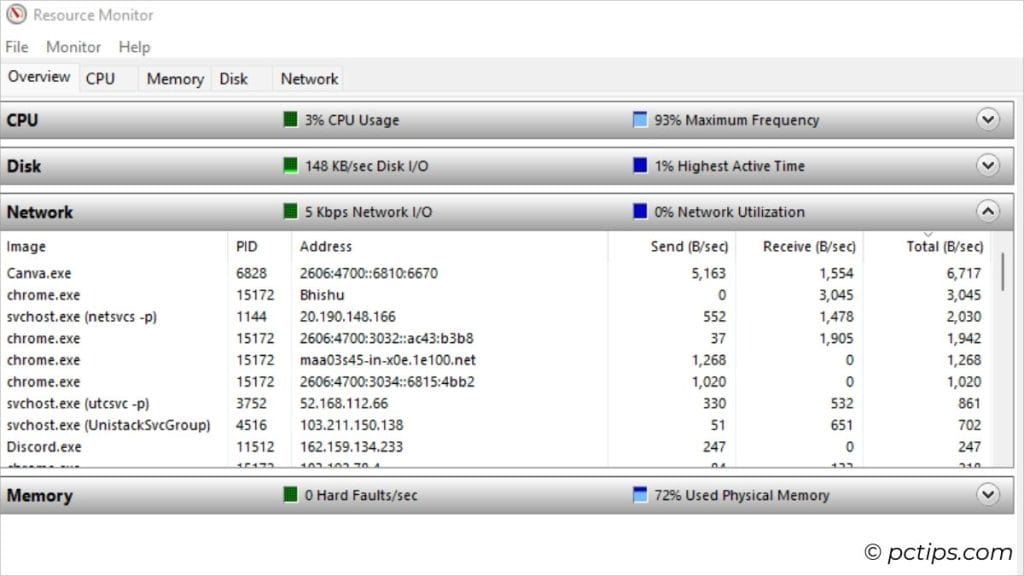
Similarly, here’s what you can monitor in the Network section:
- Network I/O (in kbps): Rate at which data is being transmitted and received over the network interface
- Network Utilization (in %): Real-time network bandwidth utilization
- Image and PID: Process name along with its process ID
- Address: Show where the process is connected to
- Send (B/sec): Avg. bytes sent over the network at the final minute
- Receive (B/sec): Avg. bytes received over the network at the final minute
- Total (B/sec): Avg. bytes sent and received over the network at the final minute
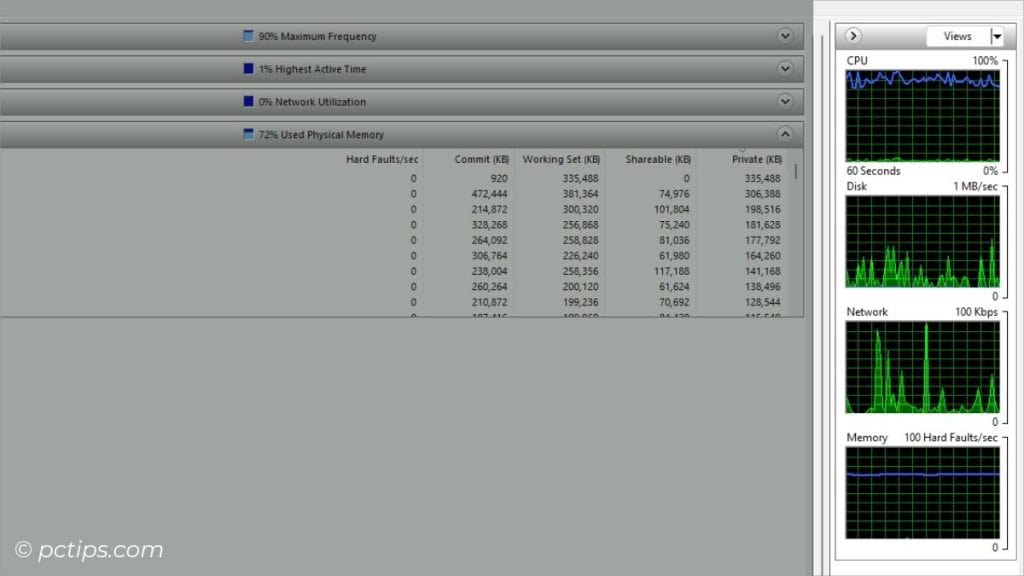
Memory
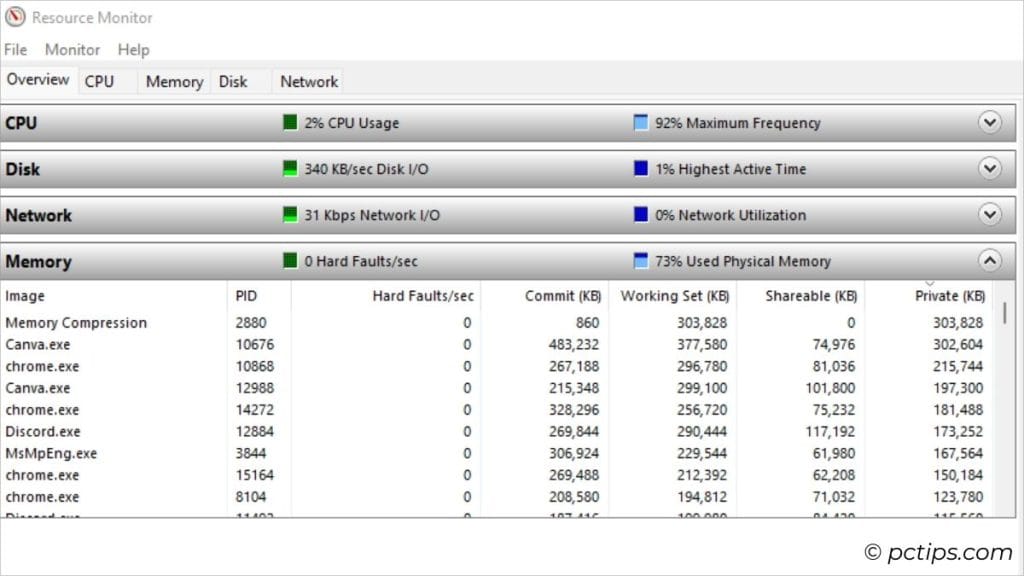
Finally, here’s what each column in the Memory field indicates:
- Hard Faults/s: Rate at which your PC is encountering page faults (higher the page faults, slower is your system)
- Used Physical Memory: RAM usage in percentage
- Image and PID: Process name along with its process ID
- Hard faults/s: This one is associated with each process
- Commit (KB): Amount of virtual memory reserved by your OS
- Working Set (KB): Amount of physical memory currently being used by the processes
- Shareable (KB): Amount of physical memory currently being used by a process and that can be shared to another process
- Private (KB): Amount of physical memory currently being used by a process and that can’t be used by another process
Pro Tip: Selecting the process in CPU will filter the processes in the Disk, Network, and Memory.
Graph
The right pane on Resource Monitor is dedicated to show the visual representation of all the resources we discussed above:
- CPU: Represents the Average CPU usage (60 seconds)
- Disk: Displays the read/write speed in MB/s
- Network: Displays the rate of data transfer over the network in Kbps
- Memory: Represents Hard faults/sec
Additional Tip: You can change the graph views. Click on the drop-down and select the size of the graph you want. I like it to be set to Default (i.e. Large).
The ‘CPU’ Tab
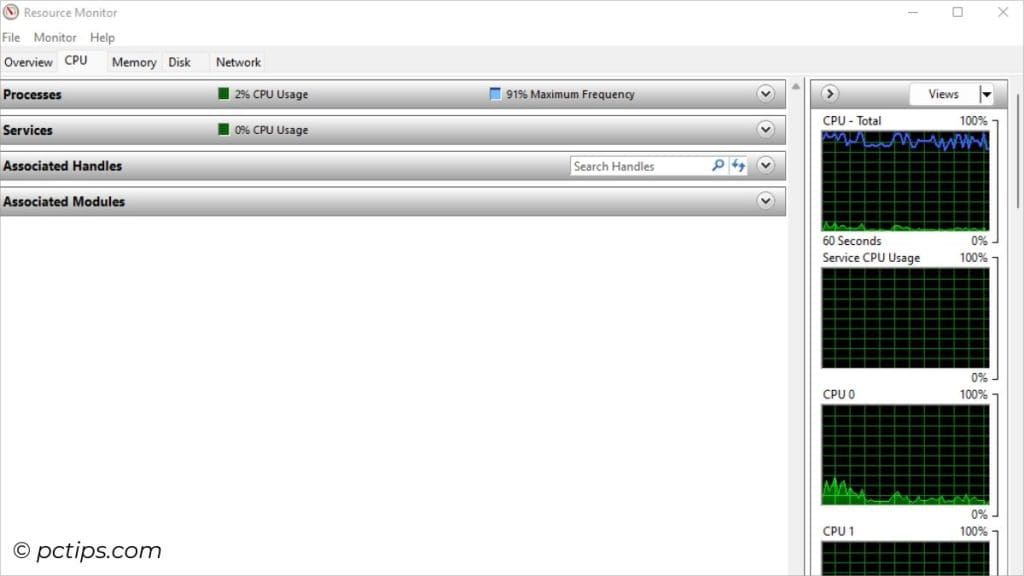
Until now, we only monitored the basics of every component.
To delve deeper, getting into each tab dedicated to specific resources would be the best approach.
Let’s get started with CPU.
Processes
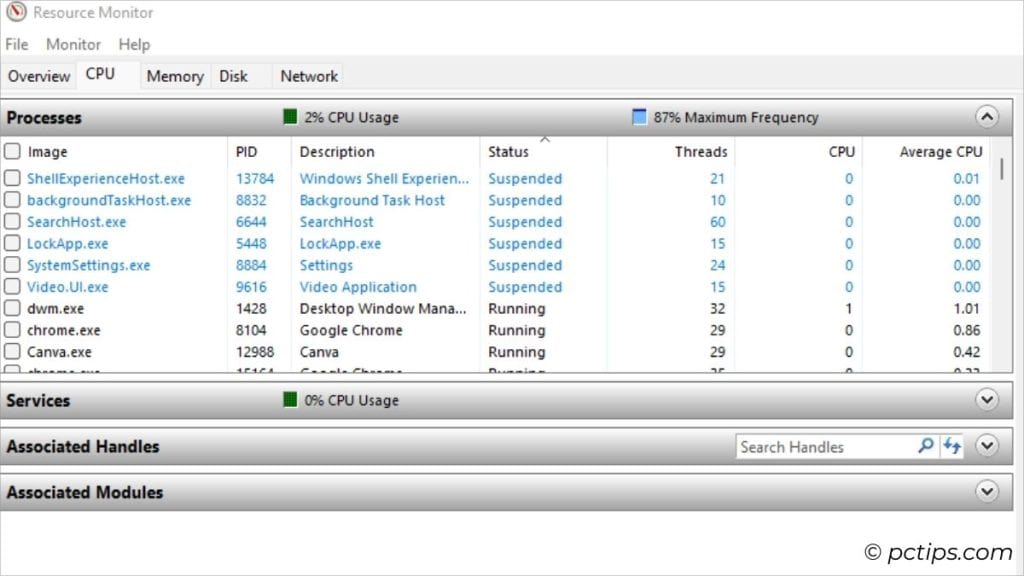
This field lists all the processes that are currently running on your PC.
Basically, it’s the same section that we saw earlier in the Overview tab.
Services
This field is actually connected with the Processes section discussed earlier.
Select a process from above and all the associated services gets listed. In case there’s none, the field becomes empty.
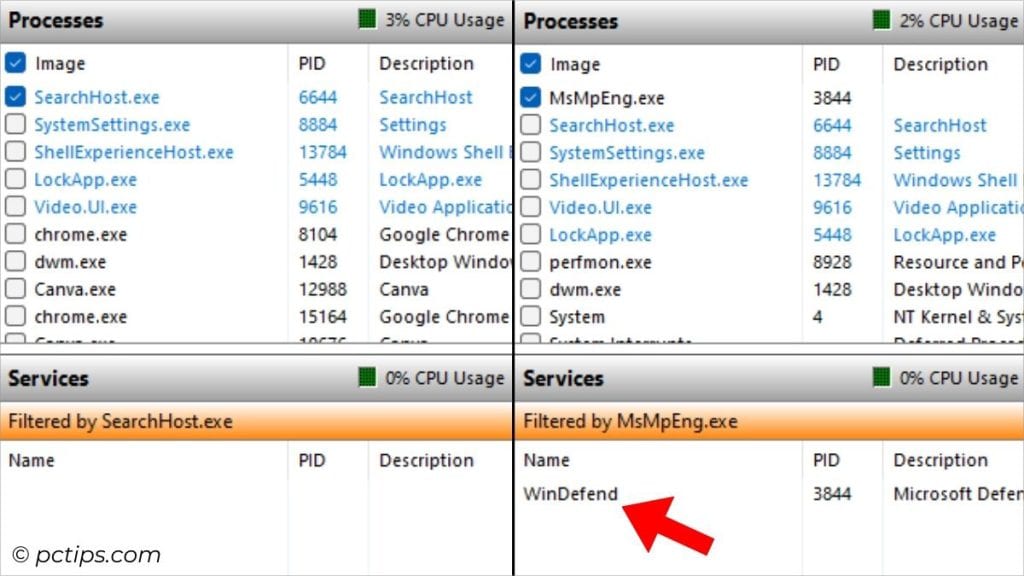
When you don’t select any process, all the services currently running on your PC is shown.
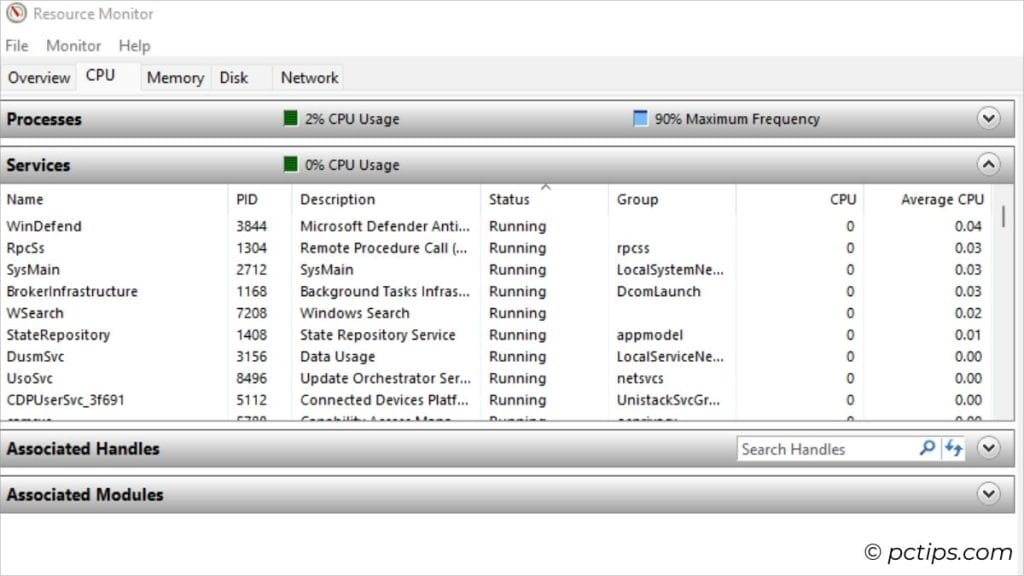
Here’s more things to explore here:
- CPU usage: Overall percentage of your processor being utilized by the services
- Name, PID, and Description: File name of each process with PID and description (different columns)
- Status: Learn whether the service is running/stopped/terminated/suspended
- Group: Service group the service falls into
- CPU and Average CPU: Real-time processor consumption and Avg. CPU consumption (in 60 seconds) by each service
Associated Handles
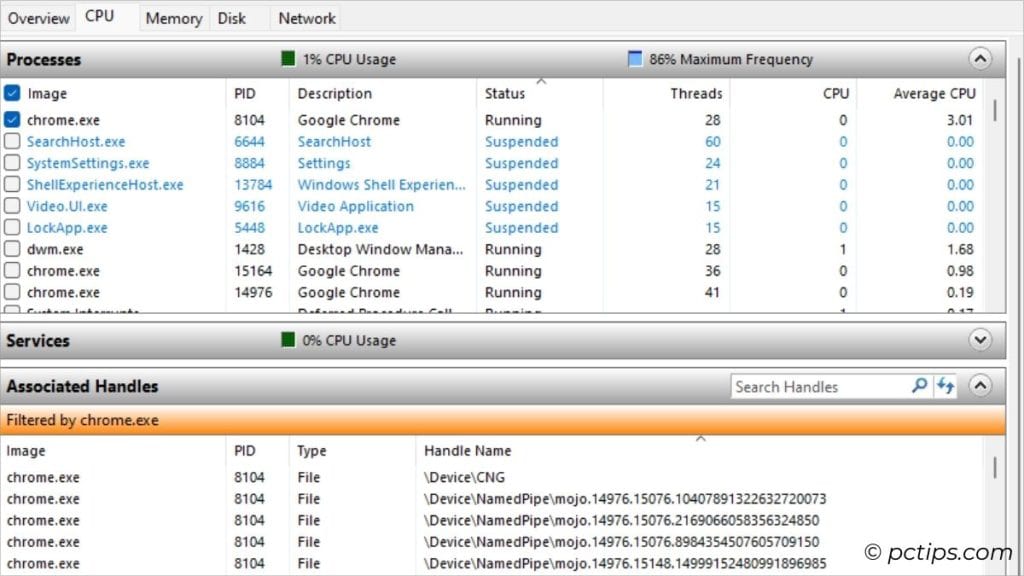
These are simply the system resources the listed processes can access.
You’ll notice at first that the field is empty. That’s because we haven’t selected any process yet.
Expand the Processes field and pick a process. As soon as you do that, ‘Filtered by X’ should be displayed along with all its associated handles.
There’s no compulsion that every service is associated with other system resources.
So, don’t get surprised if the field remains empty. It’s simply indicating that the process has no associated handles.
Here’s what each column indicate:
- Image and PID: The name of the associated handle along with it’s ID
- Type: Type of the associated handle (Directory/File/Key/Mutant/Semaphore/etc.)
- Handle Name: Path of the handle
Associated Modules
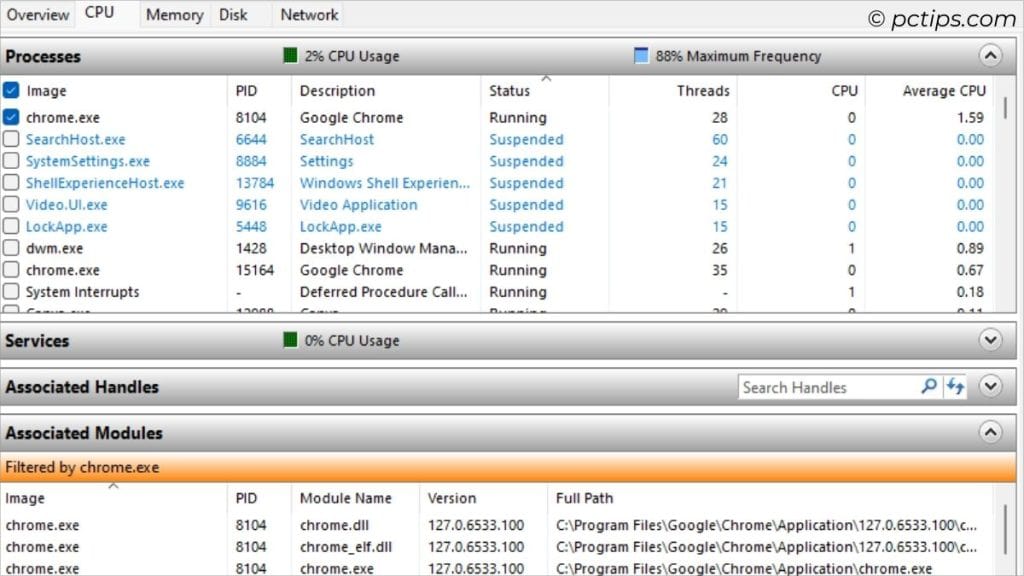
This field shows the associated DLLs or other files associated with the processes.
Just like with Associated handles, the field is empty until and unless a process is selected.
Here’s what each column represent:
- Image and PID: The name of the associated handle along with it’s ID
- Module Name: Name of the module loaded by selected processes
- Version Number: Version no. of the associated module
- Full Path: Location of the associated module
Graph
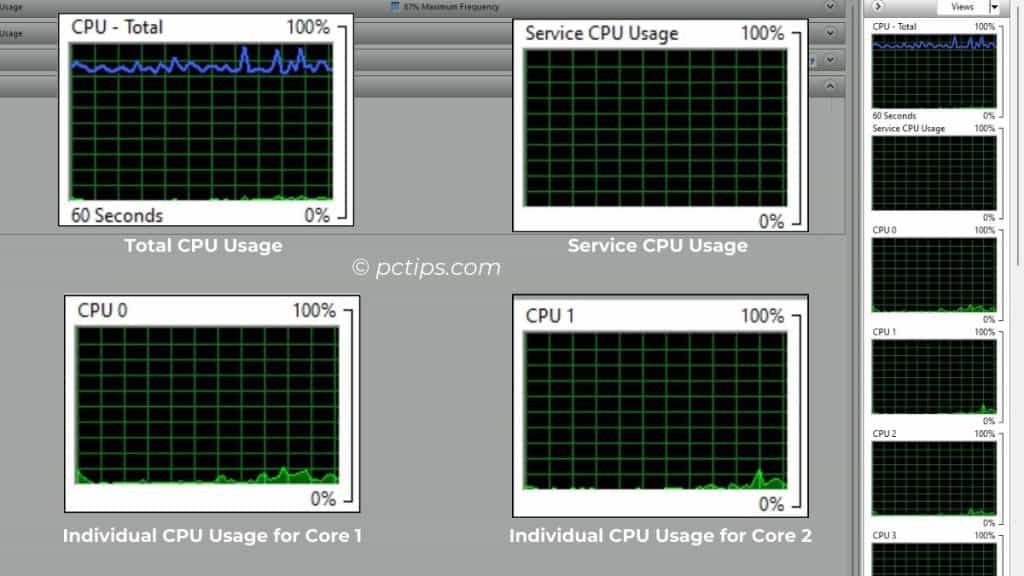
Once you switch to the CPU tab, you’ll see very different graphics now.
The first two graphs are dedicated to Total CPU Usage and Service CPU Usage respectively.
And all the remaining tabs represent the usage by individual logical processors/cores.
For example, in my case, my AMD Ryzen 7 5700G has 16 cores, hence there are 16 graphs.
This is indeed quite useful in understanding which core is being heavily loaded and which ones are idle.
The ‘Memory’ Tab
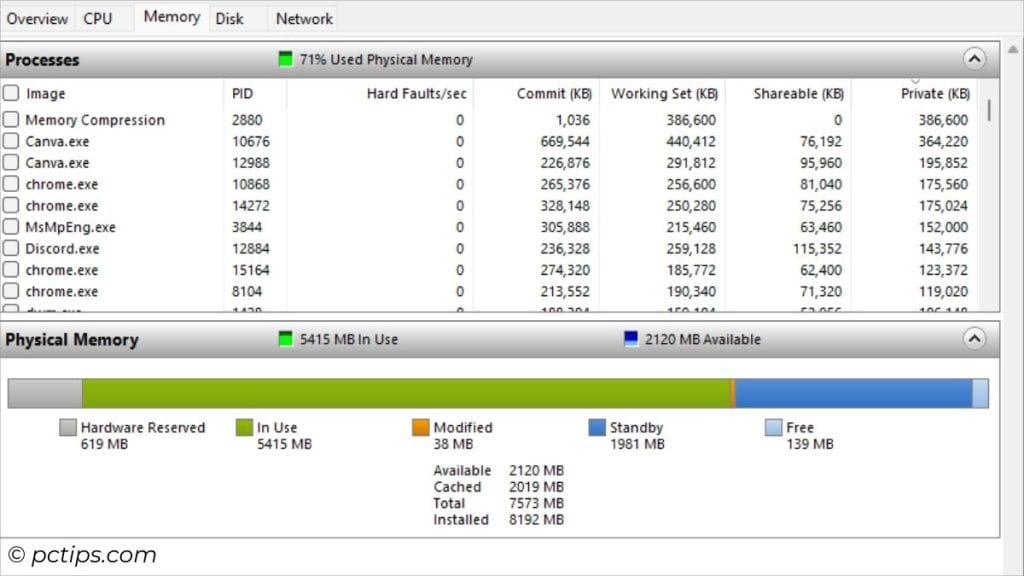
In this tab, you’re going to find two different sections – ‘Processes’ and ‘Physical Memory’.
The Processes section contains all the columns that we discussed earlier in the Overview tab.
So, let’s dive into the Physical Memory section now.
Basically, it contains the exact numbers (rather than percentage) of your physical memory
‘X’ MB In use and ‘X’ MB Available are highlighted at the top. They indicate the amount of physical memory that’s currently in use and remaining respectively.
Here’s what other values indicate:
- Hardware Reserved: Amount of space that’s allocated for BIOS and some drivers
- In Use: Same as <‘X’ MB In use>
- Modified: Memory whose contents must be written to disk before being used for another purpose
- Standby: Contains cached data and code (that’s not in use actively)
- Free: Doesn’t contain any valuable data and will be used up by processes and the OS when it requires more memory
- Available: Same as <‘X’ MB Available>
- Cached: Memory that’s cached for rapid process (includes Standby and Modified)
- Total: Overall memory available to the OS, processes, and drivers (here’s how to check programs that could be eating your RAM)
- Installed: Memory installed on your computer (part of your PC specs)
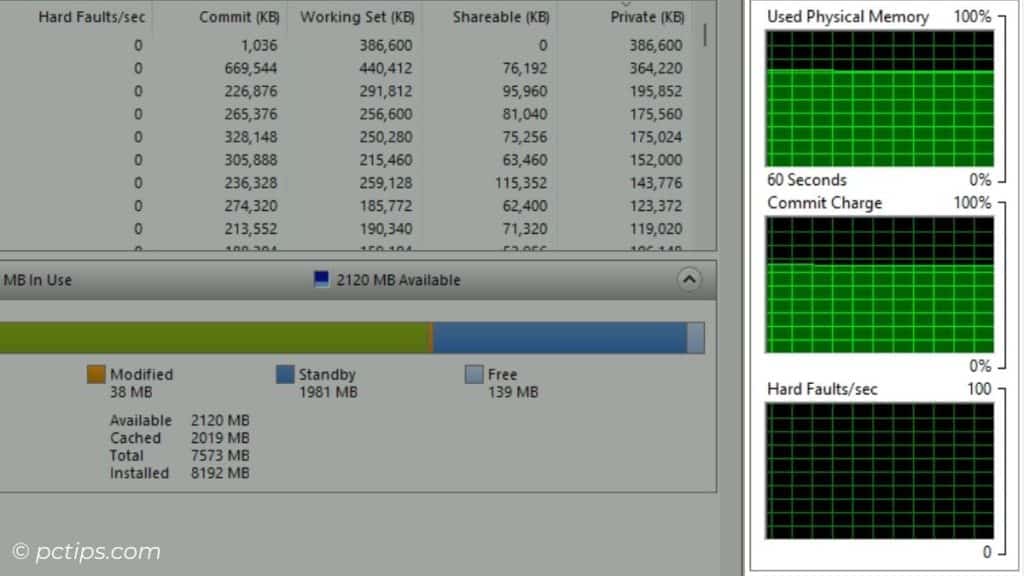
- Graph: You’ll find three different, each representing ‘Used Physical Memory’, ‘Commit Charge’, and ‘Hard faults/sec’.
You might want to read: How to know if my RAM is going bad
The ‘Disk’ Tab
This tab contains all the details that were available in the ‘Overview’ tab.
Don’t get confused with the ‘Processes with Disk Activity’ and ‘Disk Activity’ fields.
The one in the ‘Overview’ tab is the ‘Disk Activity’ and the former represents the CPU usage with disk activity.
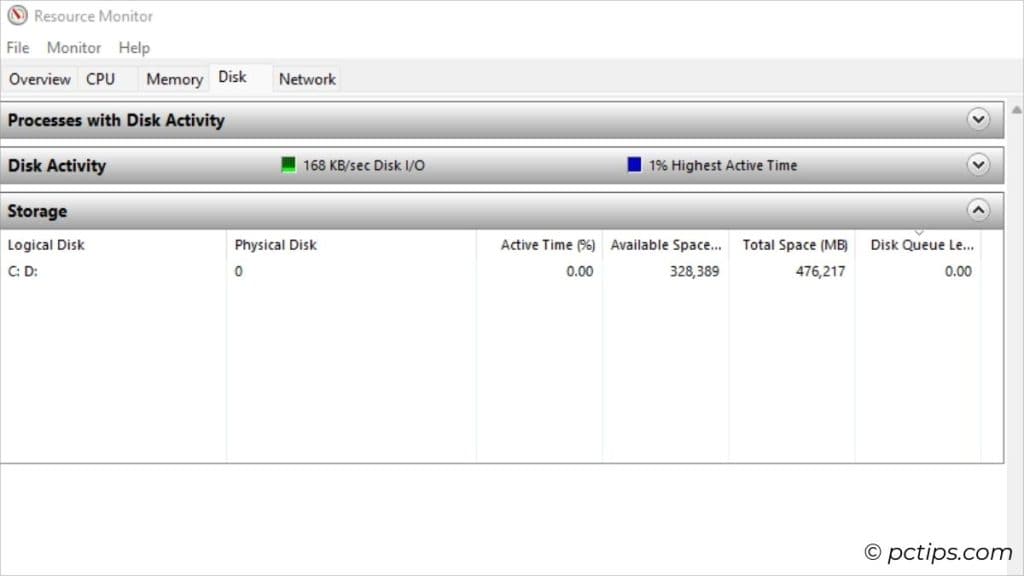
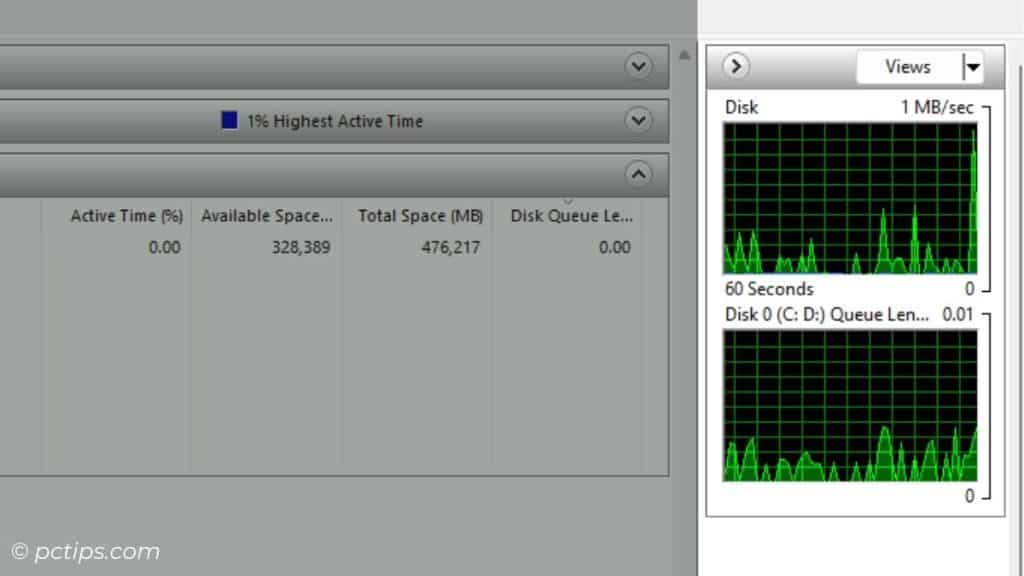
An additional section that you’ll find is ‘Storage’. It lists:
- Logical Disk: Number of disks/partitions in your system
- Physical Disk: Drive number of the disks/partitions
- Activity Time (%): Time when the disk is active (not idle)
- Available Space (MB): Free space available on your physical drive
- Total Space (MB): Total space present on your physical drive
- Disk Queue Length: I/O operations waiting to be processed by your disk
- Graph: 2 (Read/Write speed in 1 MB/s and Disk Queue Length)
The ‘Network’ Tab
Similar to monitoring the disk activity, this tab has two important sections – ‘Processes with Network Activity’ and ‘Network Activity’.
The ‘Processes with Network Activity’ lists all the processes (same as the CPU section in the ‘Overview’ tab) while the ‘Network Activity’ is same as the ‘Network’ tab.
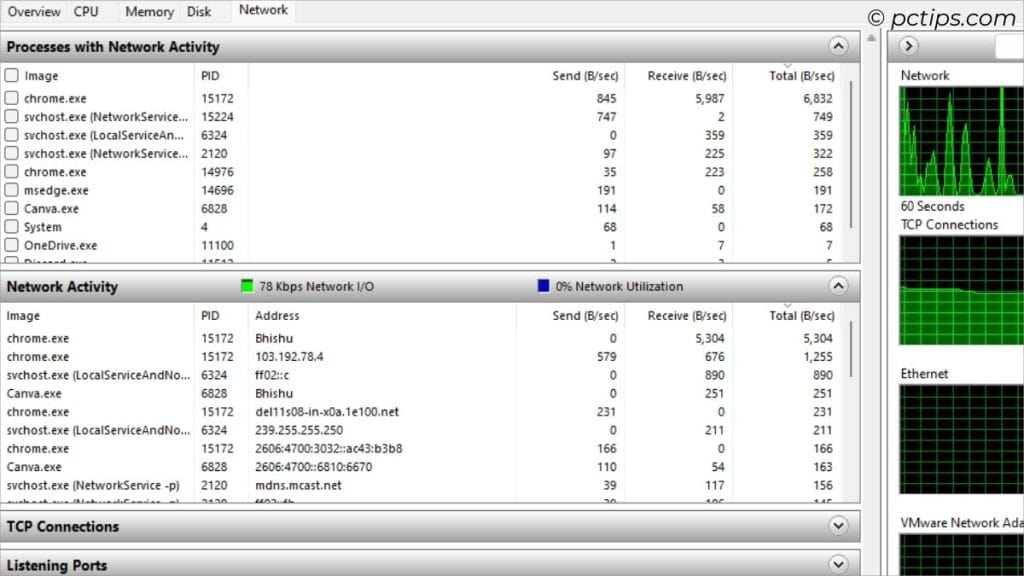
Selecting a particular process from the ‘Processes with Network Activity’ filters out the processes in the other fields (as we saw with the other tabs too).
Now, let’s focus on the two new sections for advanced network monitoring in Resource Monitor:
TCP Connections
As the name suggests, this section lists all the active TCP (Transmission Control Protocol) connections on your PC.
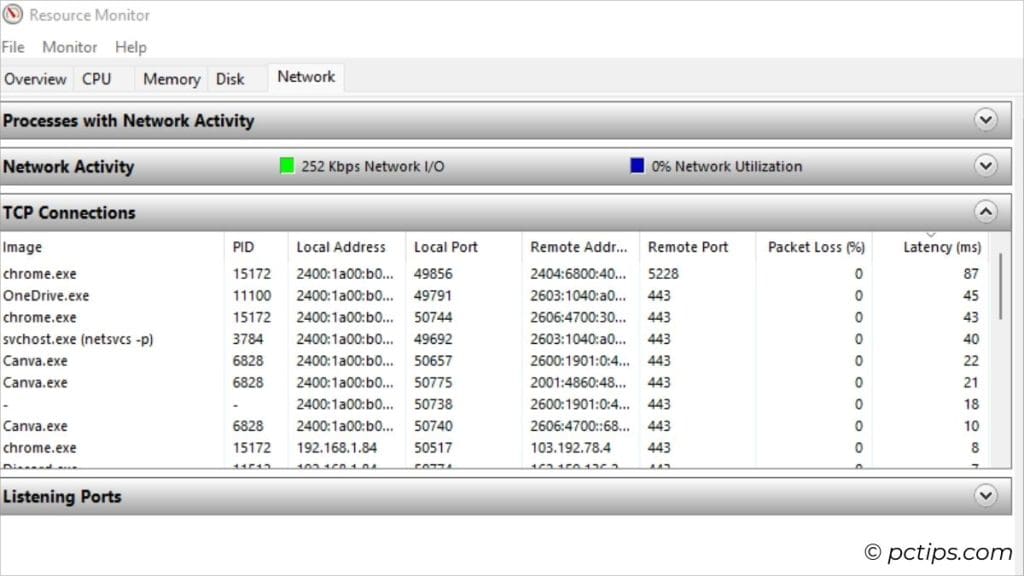
Here’s what each column indicate:
- Image and PID: Process name with its ID
- Local Address: The connection’s local IP address
- Local Port: The connection’s port number
- Remote Address: The remote IP address of the device/server your PC is connected to your PC
- Remote Port: The remote port number of the device/server your PC is connected to your PC
- Packet Loss (%): Failure rate of data packets (those packets that couldn’t reach the destination)
- Latency (ms): Time data packets take to travel from your PC to the server and back
You might want to read: Best DNS servers for faster and secure internet
Listening Ports
This section lists all the open ports on your computer that are waiting for incoming connections.
Understand it this way – when the service “listens” on a port, it’s indicating that it’s ready for communication via the provided port.
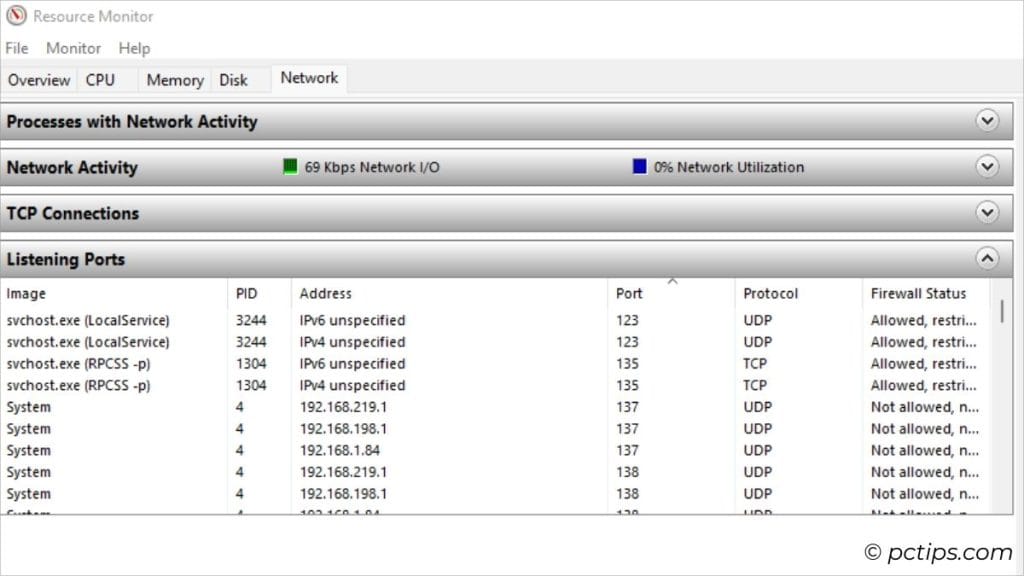
Now, let’s get into what each column signify:
- Image and PID: Process name with its ID
- Address: IP address associated with the listening port
- Port: Specific port number currently being used by the process
- Protocol: Type of network protocol used (e.g.: TCP, UDP, etc.)
- Firewall Status: Displays whether the firewall restricts the specific port (Allowed, restricted / Allowed, not restricted, Not Allowed, not restricted)
Graph
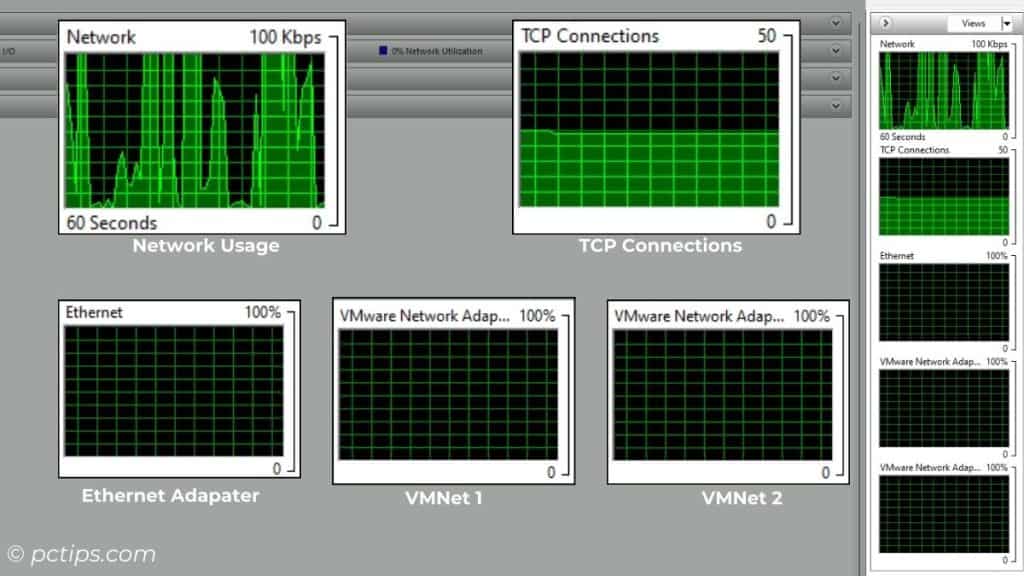
The ‘Network’ tab features multiple network graphs.
The first two are for ‘Network’ and ‘TCP Connections’ respectively. And those graphs after them include visual representation of all the network adapter on your system.
For example, mine comes with three (one for Ethernet and other two for VMnets).
If your PC supports Wi-Fi, you’ll likely see one graph dedicated for that as well.
Related: Why you should avoid using public Wi-Fi
Sorting the Columns
As you’re monitoring the components in Resource Monitor, here’s a trick you should learn that’s going to save your time and effort.
You can click on any column from any tab to arrange the listed processes/applications in ascending/descending order.
Let me show you an example.
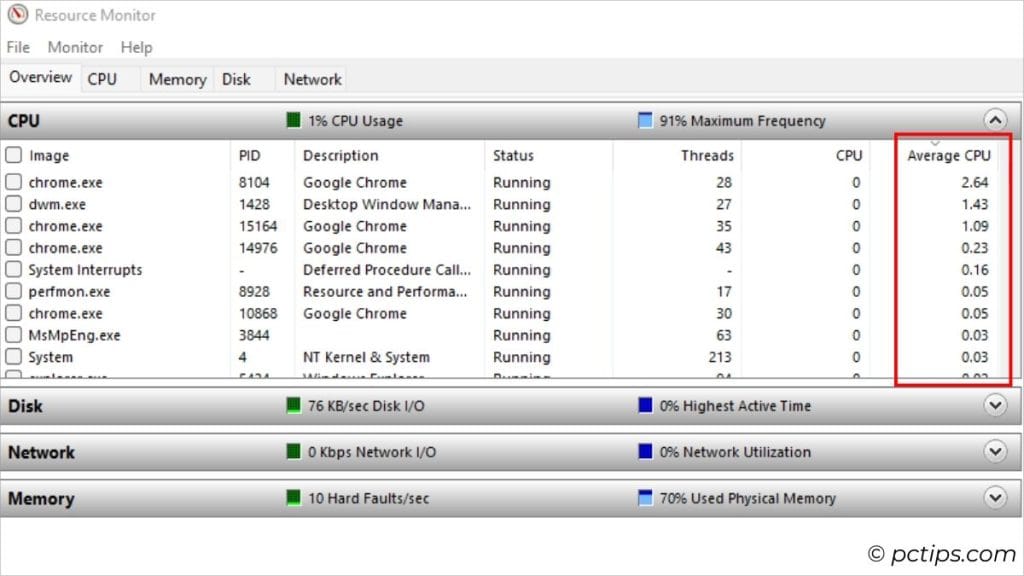
I want to check the processes with the highest average CPU usage. I’ll click on that tab and there I have it. It’s that simple!
Save, Load, and Restore Resource Monitor Settings
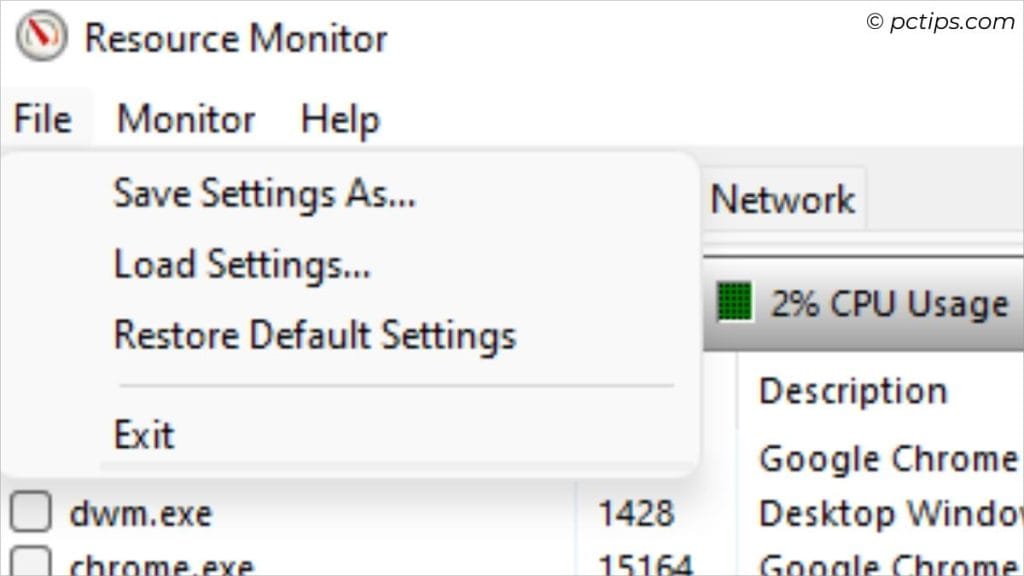
Yup, Windows Resource Monitor even lets you save your current configuration into a .Resmoncfg file.
Just choose File > Save settings as > Name the file > Save
Now, you can load this setting in another PC or even your own later in the future:
File > Load settings > Select the file > Open
And what if you changed something in Resource Monitor and want to revert the settings?
Don’t sweat it. The file menu comes with the Restore Default Settings option as well!
Stop/Start Monitoring
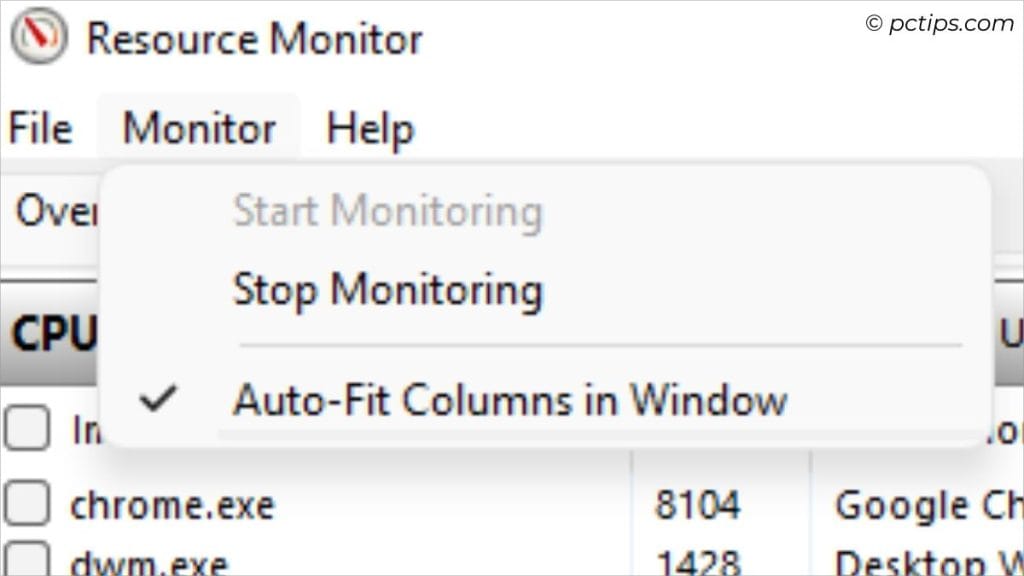
With Resource Monitor, we are tracking the live stats of every component. And it’s absolutely true that the values are dynamic.
Sometimes, we miss out on things for sure. But if you want to freeze the data for in-depth analysis, the Stop Monitoring feature comes in handy.
I often do this to save the current configuration and compare it later with another configuration.
All you have to do is navigate to the Monitor menu > Stop Monitoring. Notice that the app stops monitoring the components?
To let Resource Monitor continue with the monitoring, get back to the Monitor menu and select Start Monitoring.
Wrapping Up
Congratulations! You’ve mastered using Windows Resource Monitor.
Let me know if I missed out on anything or you have any sort of queries. And don’t forget to share this article with your family and friends.
Here are some similar Windows guides that you’ll love to learn in-depth: